Here's a basic outline of how a microarray works...
Microarray technology makes use of the sequence resources created by the genome
projects and other sequencing efforts to reveal what genes are expressed in a particular
cell type of an organism, at a particular time, under particular conditions (Brown and
Botstein, 1999). For instance, they allow comparison of gene expression between normal
and diseased (e.g., cancerous) cells. There are several names for this technology - DNA
microarrays, DNA arrays, DNA chips, gene chips, others. Sometimes a distinction is made
between these names but in fact they are all synonyms as there are no standard definitions
for which type of microarray technology should be called by which name.
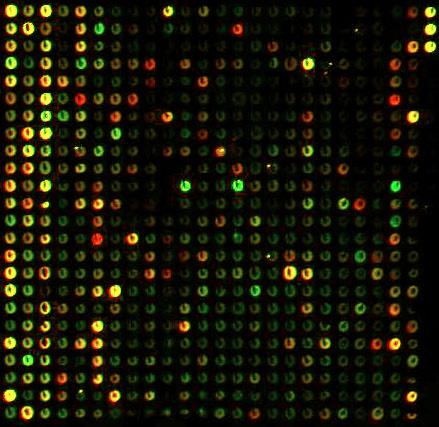
This is the final product
where a computer program looks at the
array and compares the intensity of every square (and therefore every gene),
in order to compare it's level of expression.
The total mRNA from the cells in two different conditions is extracted and
labelled with two different fluorescent labels: for example a green dye for
cells at condition 1 and a red dye for cells (colours may vary) at condition 2
(to be more accurate, the labelling is typically done by synthesizing single
stranded DNAs that are complementary to the extracted mRNA by a enzyme called reverse
transcriptase) (Debouck and Goodfellow, 1999). Both extracts are washed over the microarray.
Labelled gene products from the extracts hybridize to their complementary sequences in the
spots due to the preferential binding - complementary single stranded nucleic acid sequences
tend to attract to each other and the longer the comlementary parts, the stronger the attraction
(Brown and Botstein, 1999).
The dyes enable the amount of sample bound to a spot to be measured by the level of
fluorescence emitted when a laser excites it. If the RNA from the sample in condition
1 is in abundance, the spot will be green, if the RNA from the sample in condition 2 is
in abundance, it will be red. If both are equal, the spot will be yellow, while if neither is
present it will not fluoresce and appear black (Brown and Botstein, 1999). Thus, from the
fluorescence intensities and colours for each spot, the relative expression levels of the genes
in both samples can be estimated. The raw data that are produced from microarray experiments are
the hybridised microarray images. To obtain information about gene expression levels, these images
should be analysed, each spot on the array identified, its intensity measured and compared to the
background
references
1. Brown PO, Botstein D. (1999). Exploring the new world of the genome with DNA microarrays. Nat Genet Jan; 21(1 Suppl):33-7
2. Debouck C, Goodfellow PN. (1999). DNA microarrays in drug discovery and development. Nat Genet Jan;21(1 Suppl):48-50
3. Microarray picture and information used by permission courtesy of European
Bioinformatics Institute