Gene expression mapping
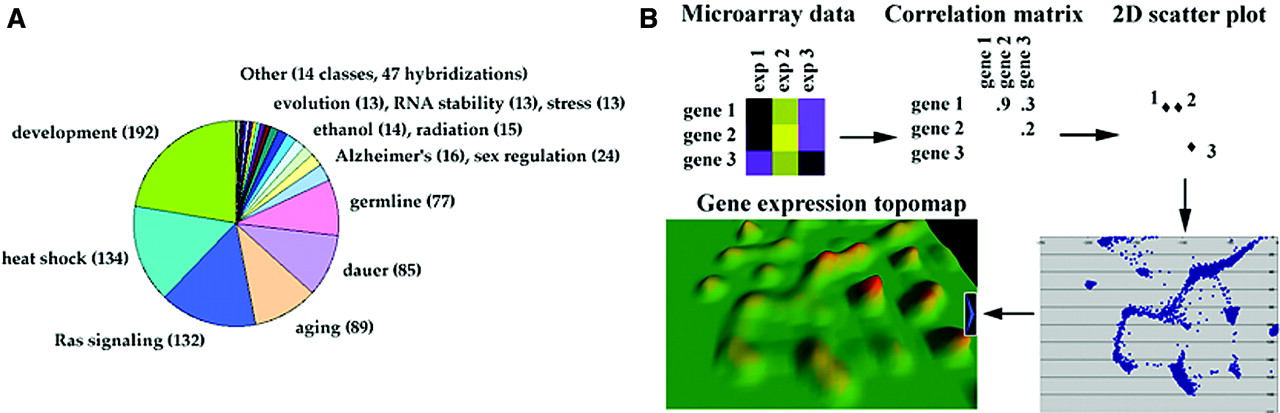
Recently, a gene expression map was created by combining the data from 553 DNA microarray
experiments, involving 17817 genes (94% of the genome), comparing RNA from mutants and wild-type
animals (Kim et al., 2001). First, a matrix containing the relative expression level for each
gene in each experiment was constructed. Then, the correlation coefficient between genes was
plotted on a 2-D scatterplot. Using a computer program called VxInsight; the spatial distribution
of the genes was visualised resulting in genes with a high correlation placed near to each other.
A third dimension was added based on the density of genes within an area. The result of the
procedure was a 3-D map with mountains representing clusters of related genes. Some mountains
contained genes expressed in similar tissues, while others contained genes having similar
cellular functions. The terrain map offers a way to study many genes at once to determine gene
functions on a global scale (Kim et al., 2001). The gene expression map is superior to individual
microarrays. It not only groups genes in to families, but it also reveals the relationship between
genes in comparison to other genes in the family based on the distance between genes in a
mountain.